Where Care Meets Precision
At Mangalam Diagnostic Centre, we pride ourselves on delivering diagnostic services that are precise, cost-effective, and trustworthy.
Your Health is Our Priority
Accuracy You Can Rely On, Care You Deserve.
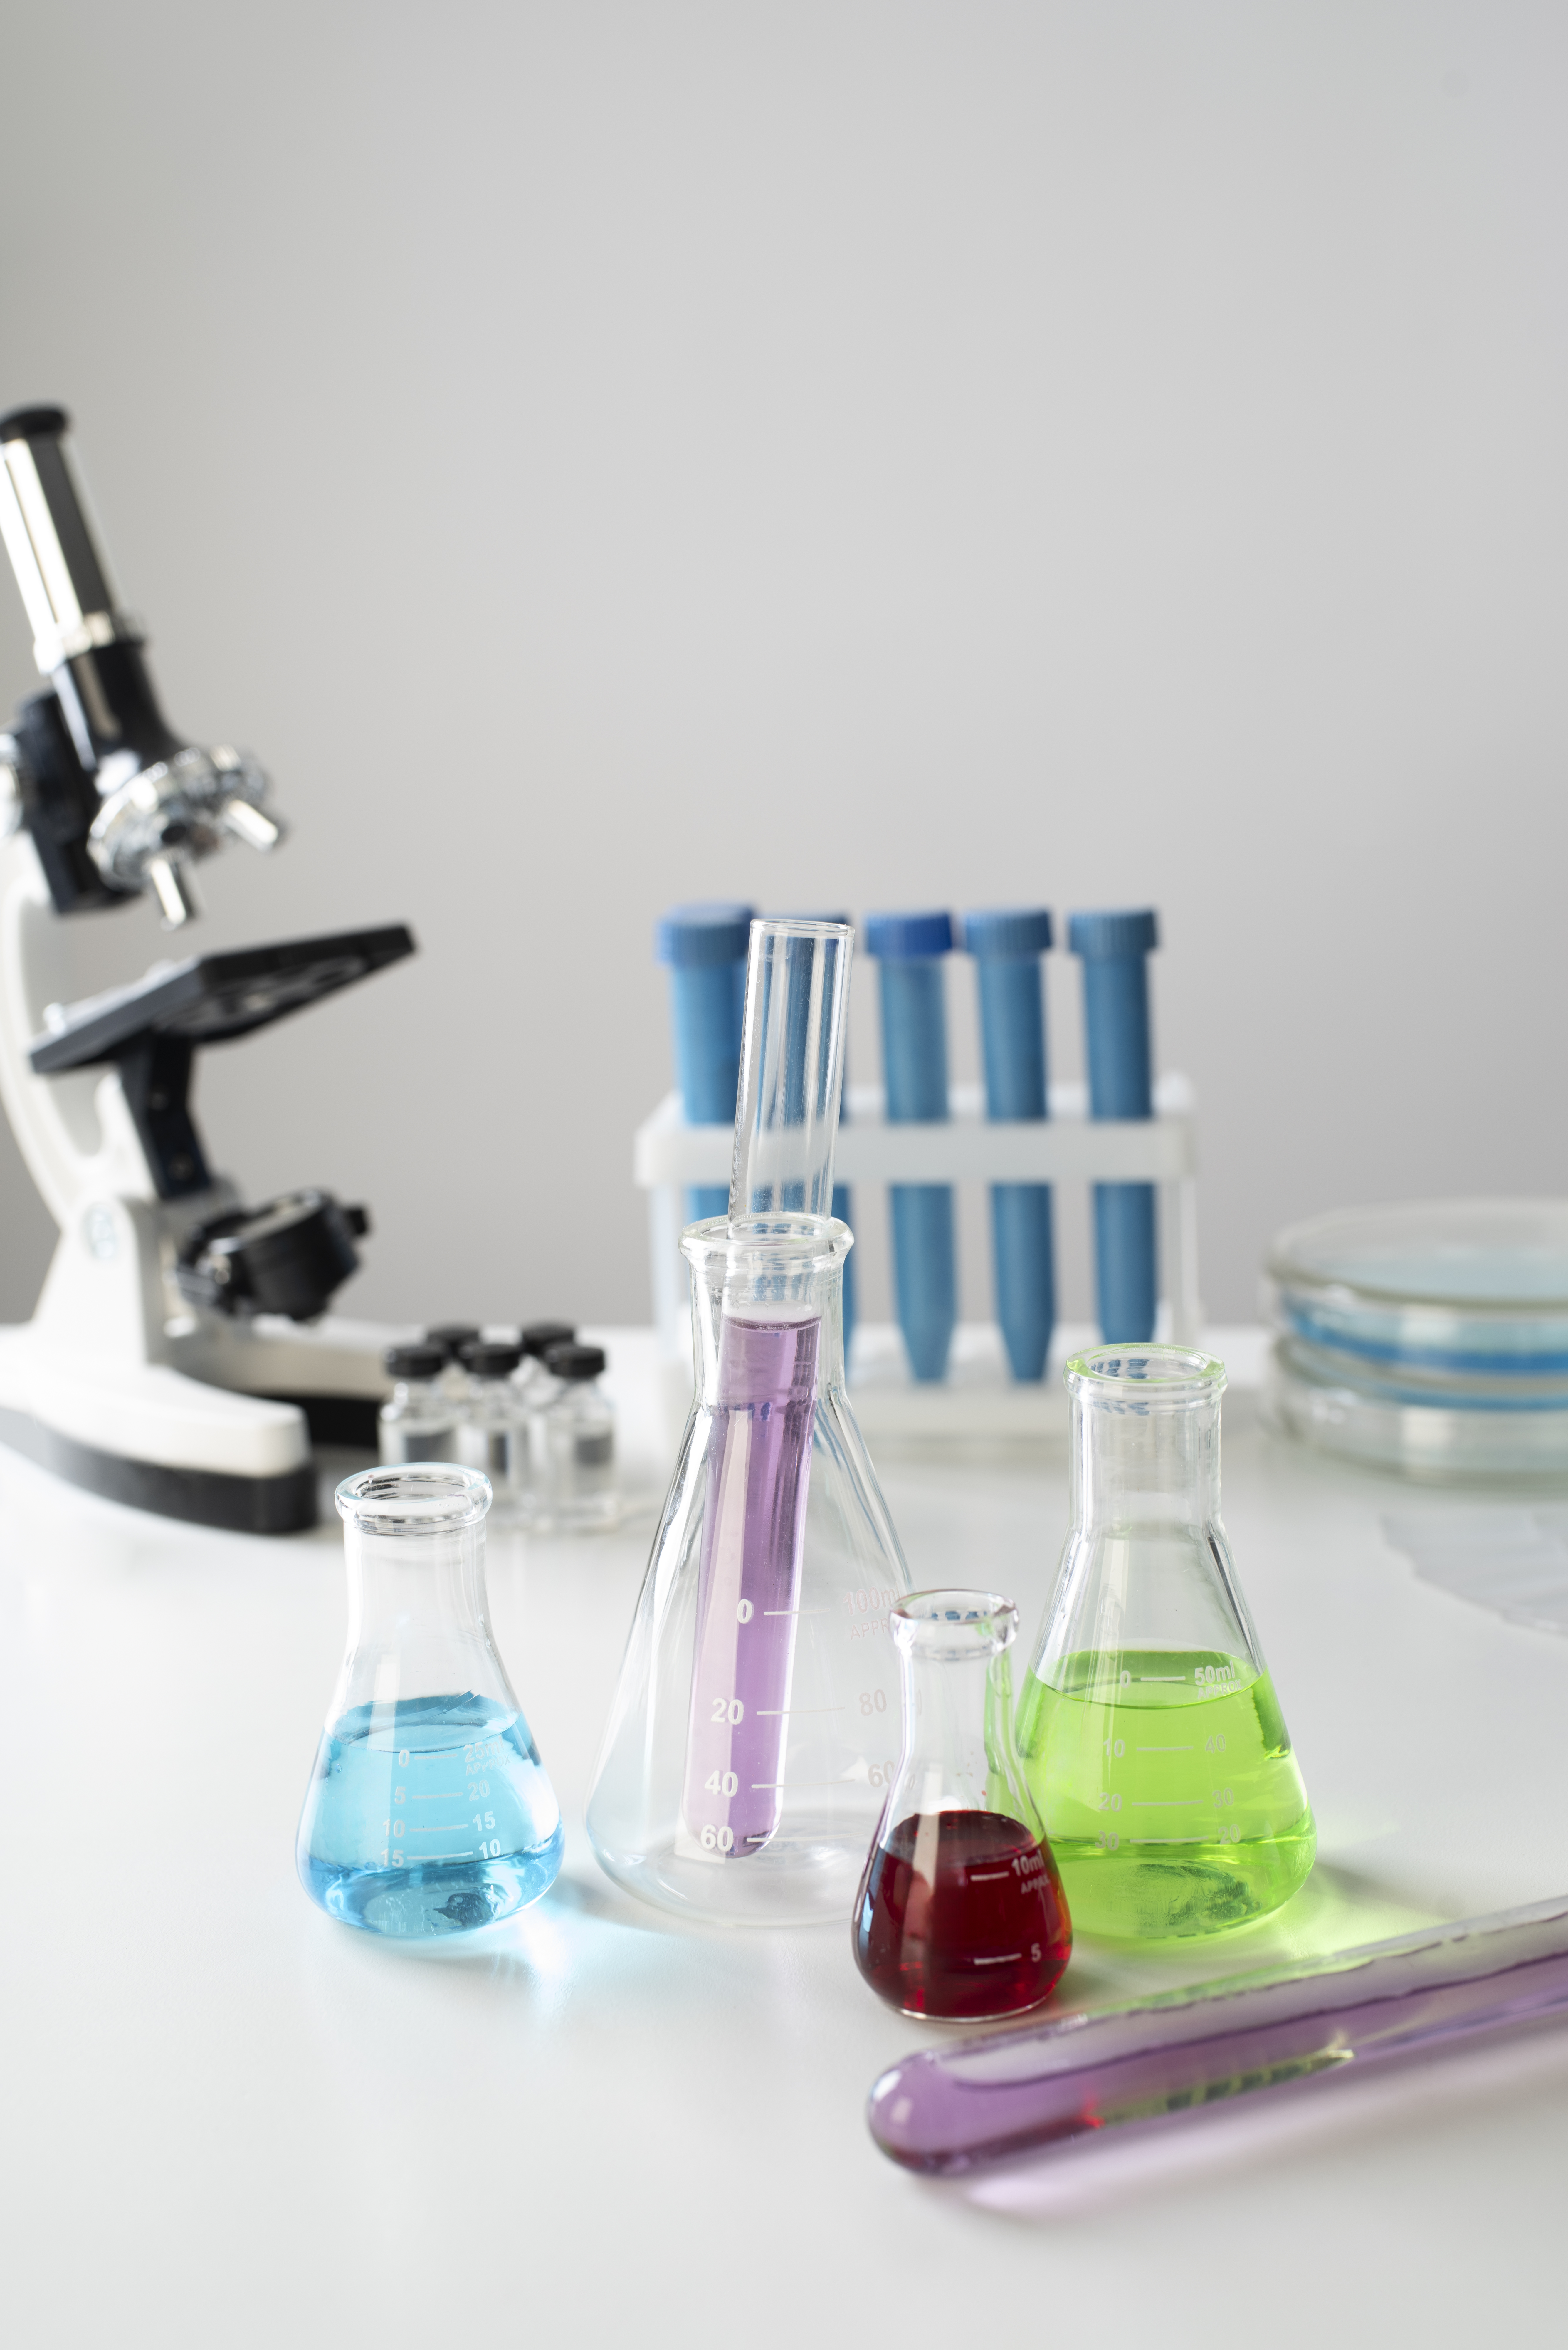
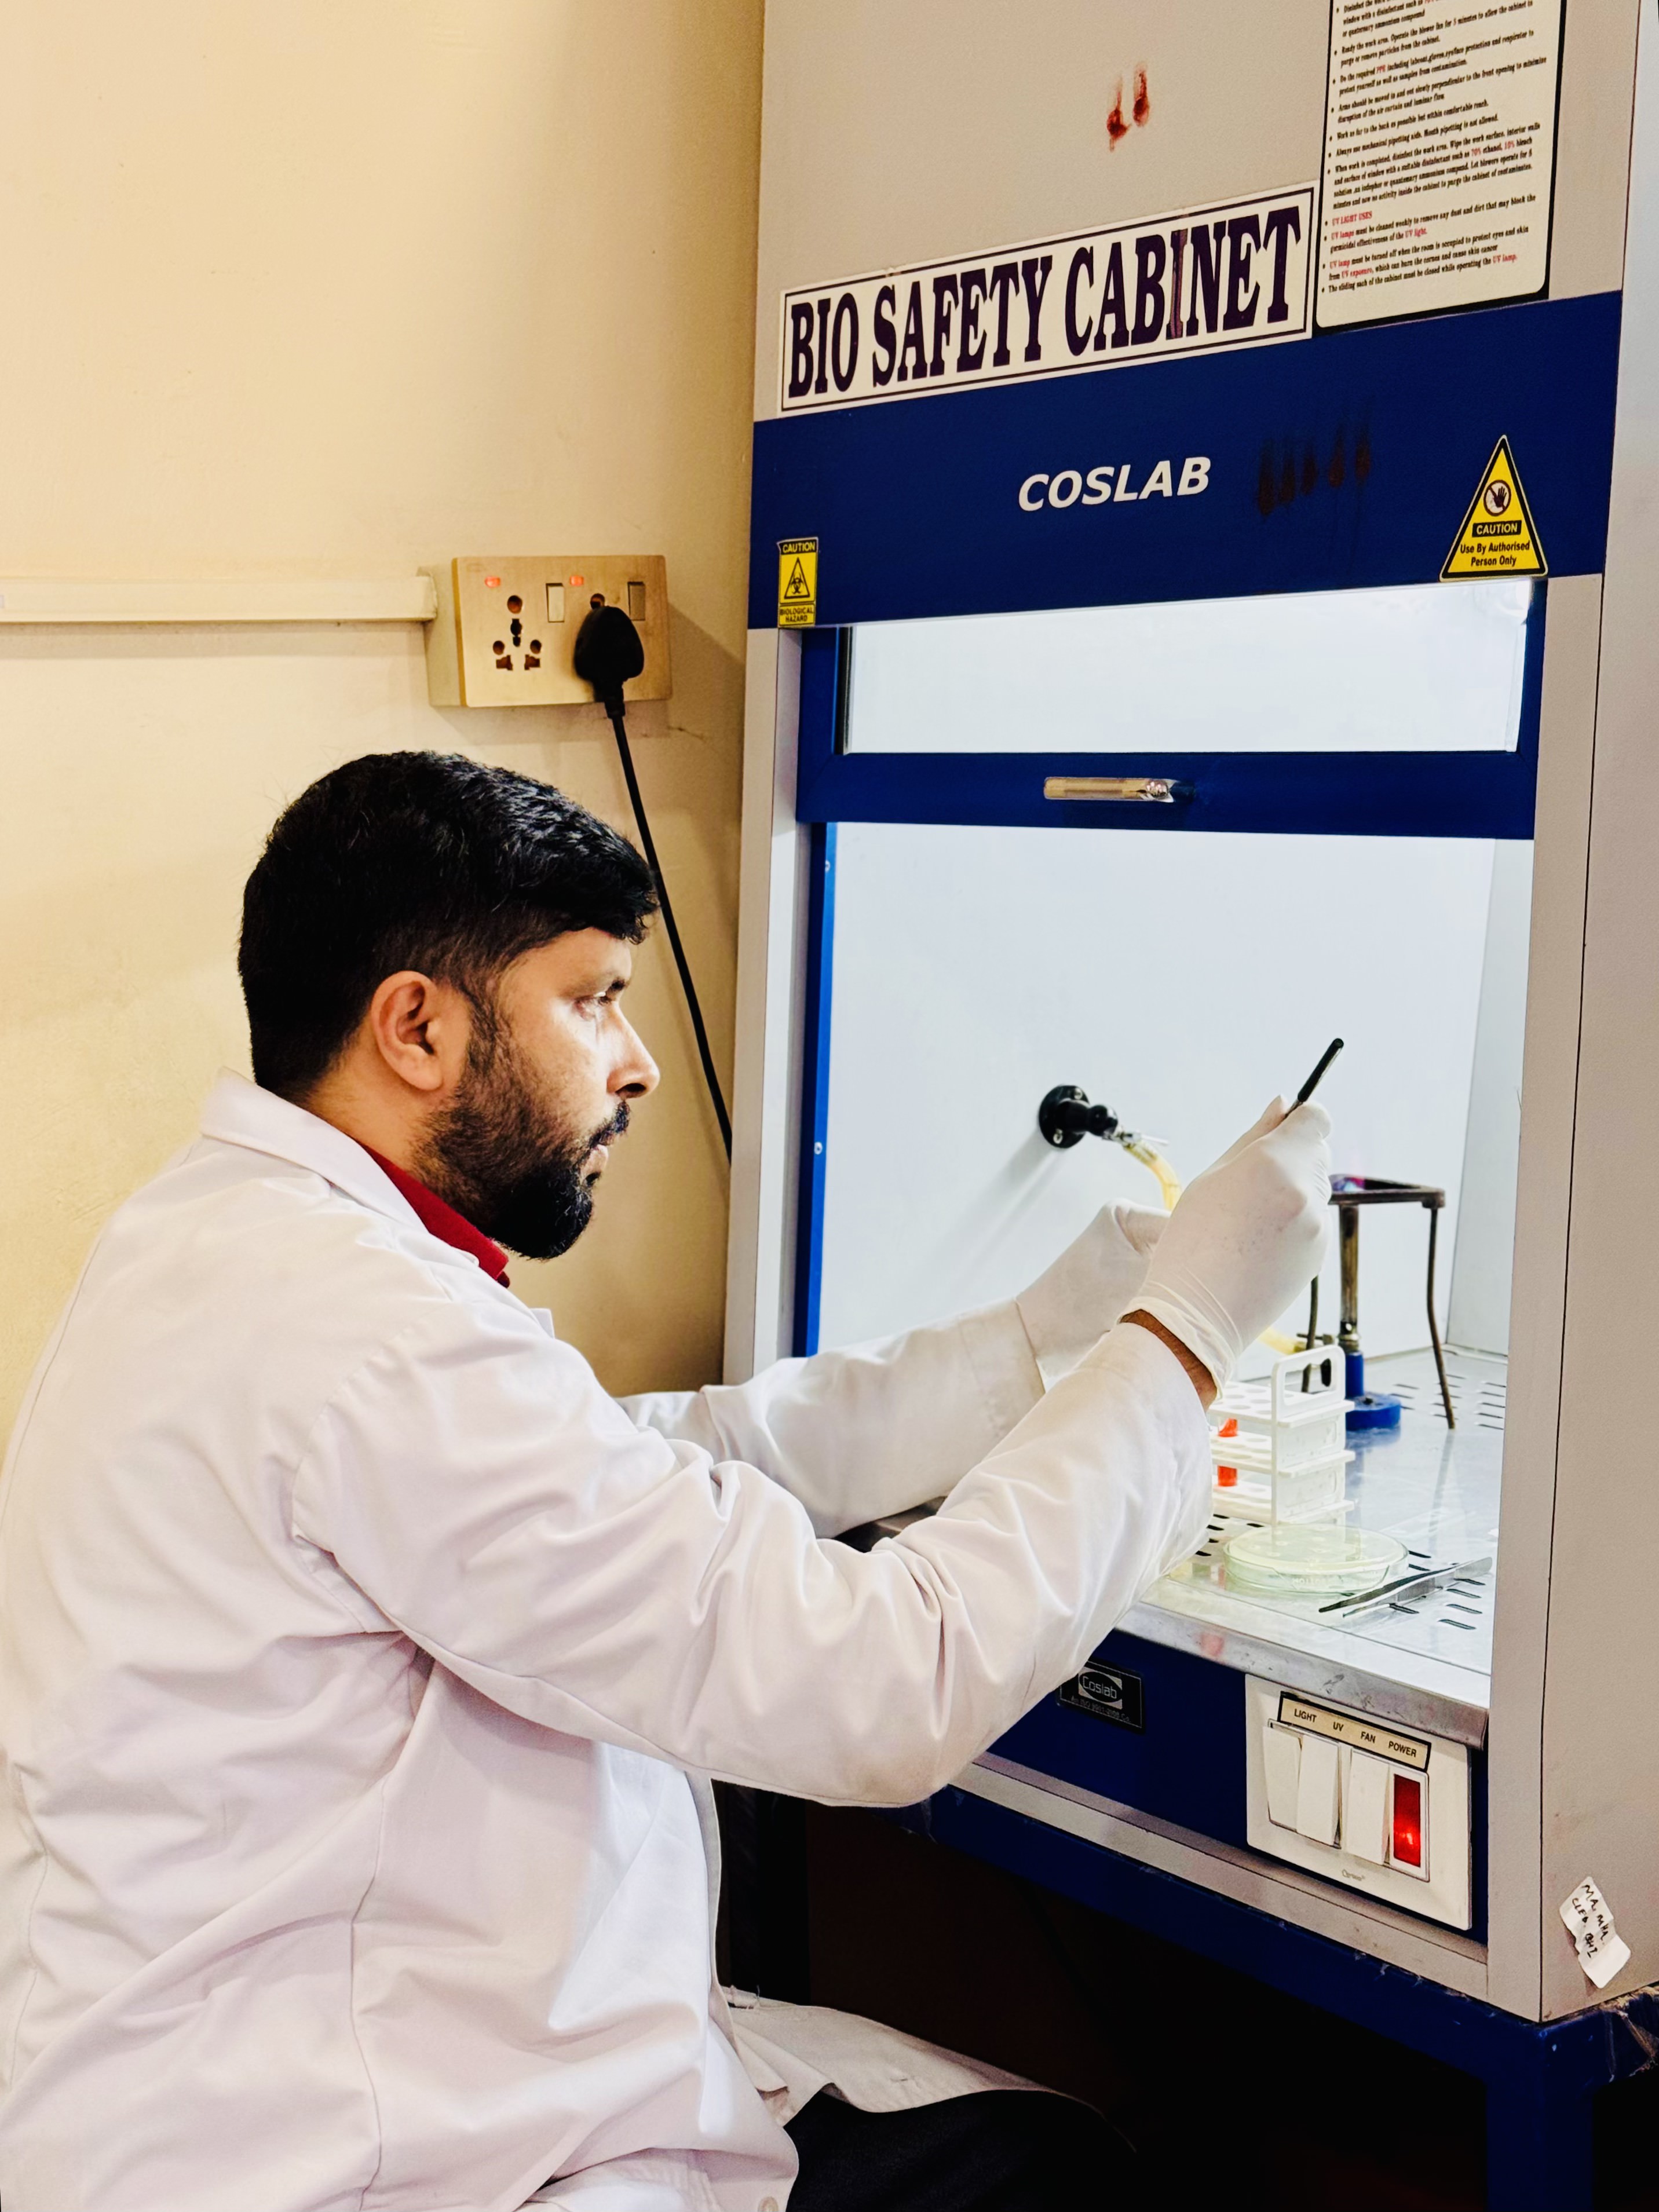
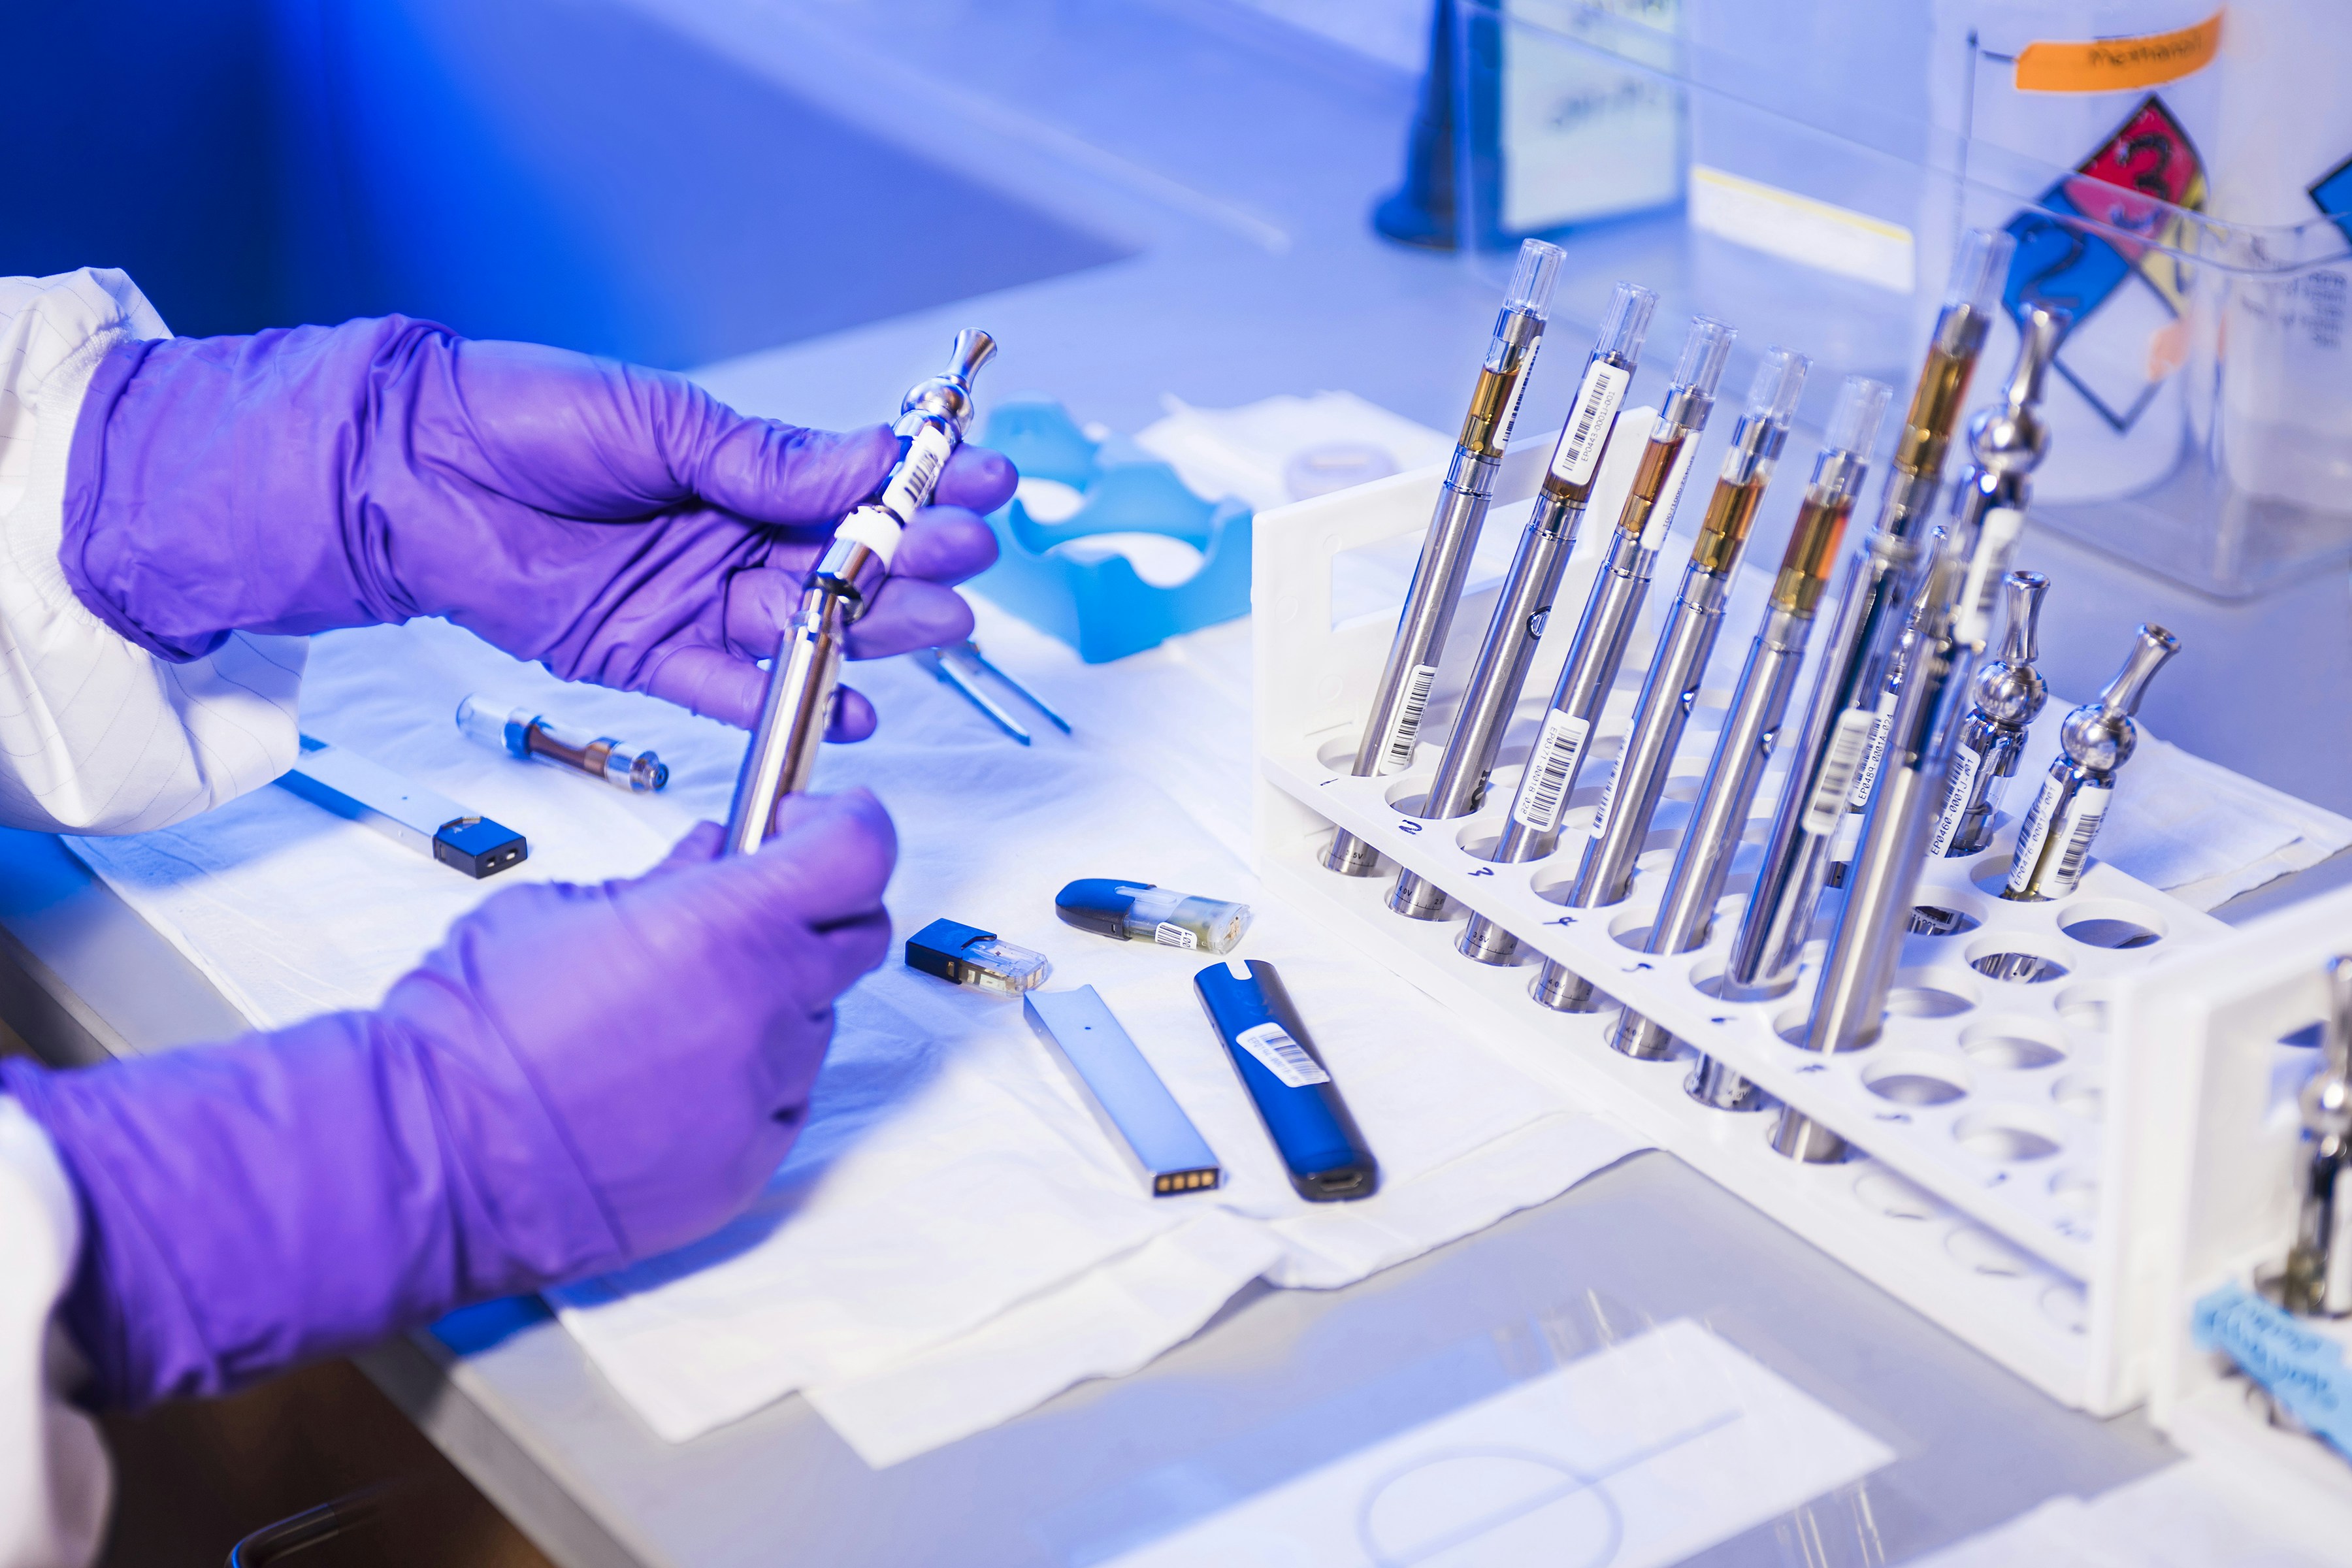
Advanced Diagnostic Technology
State-of-the-art equipment for accurate results
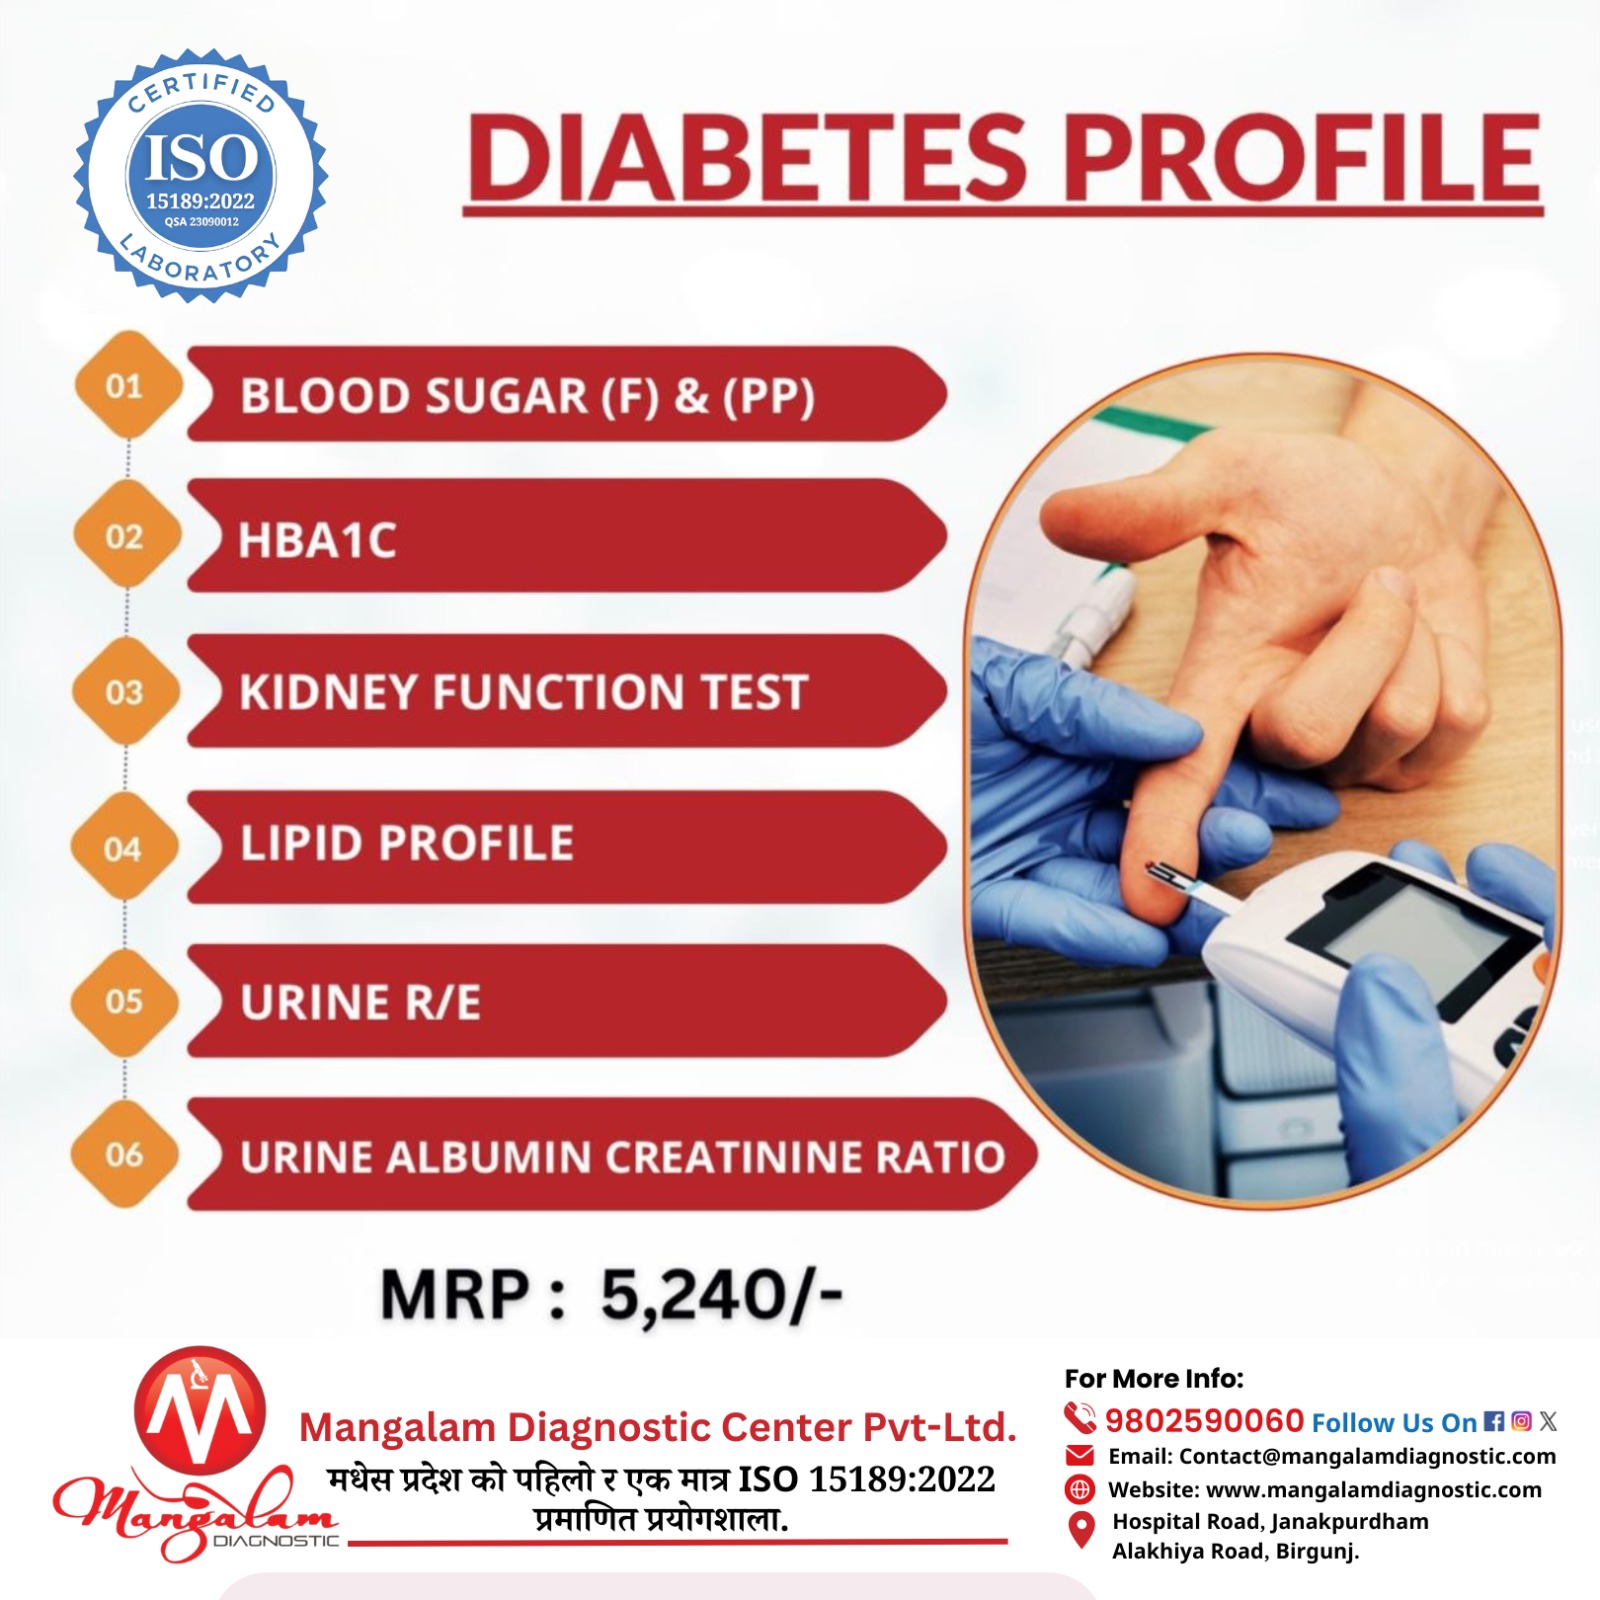
Diabetes Management
Comprehensive diabetes testing and monitoring
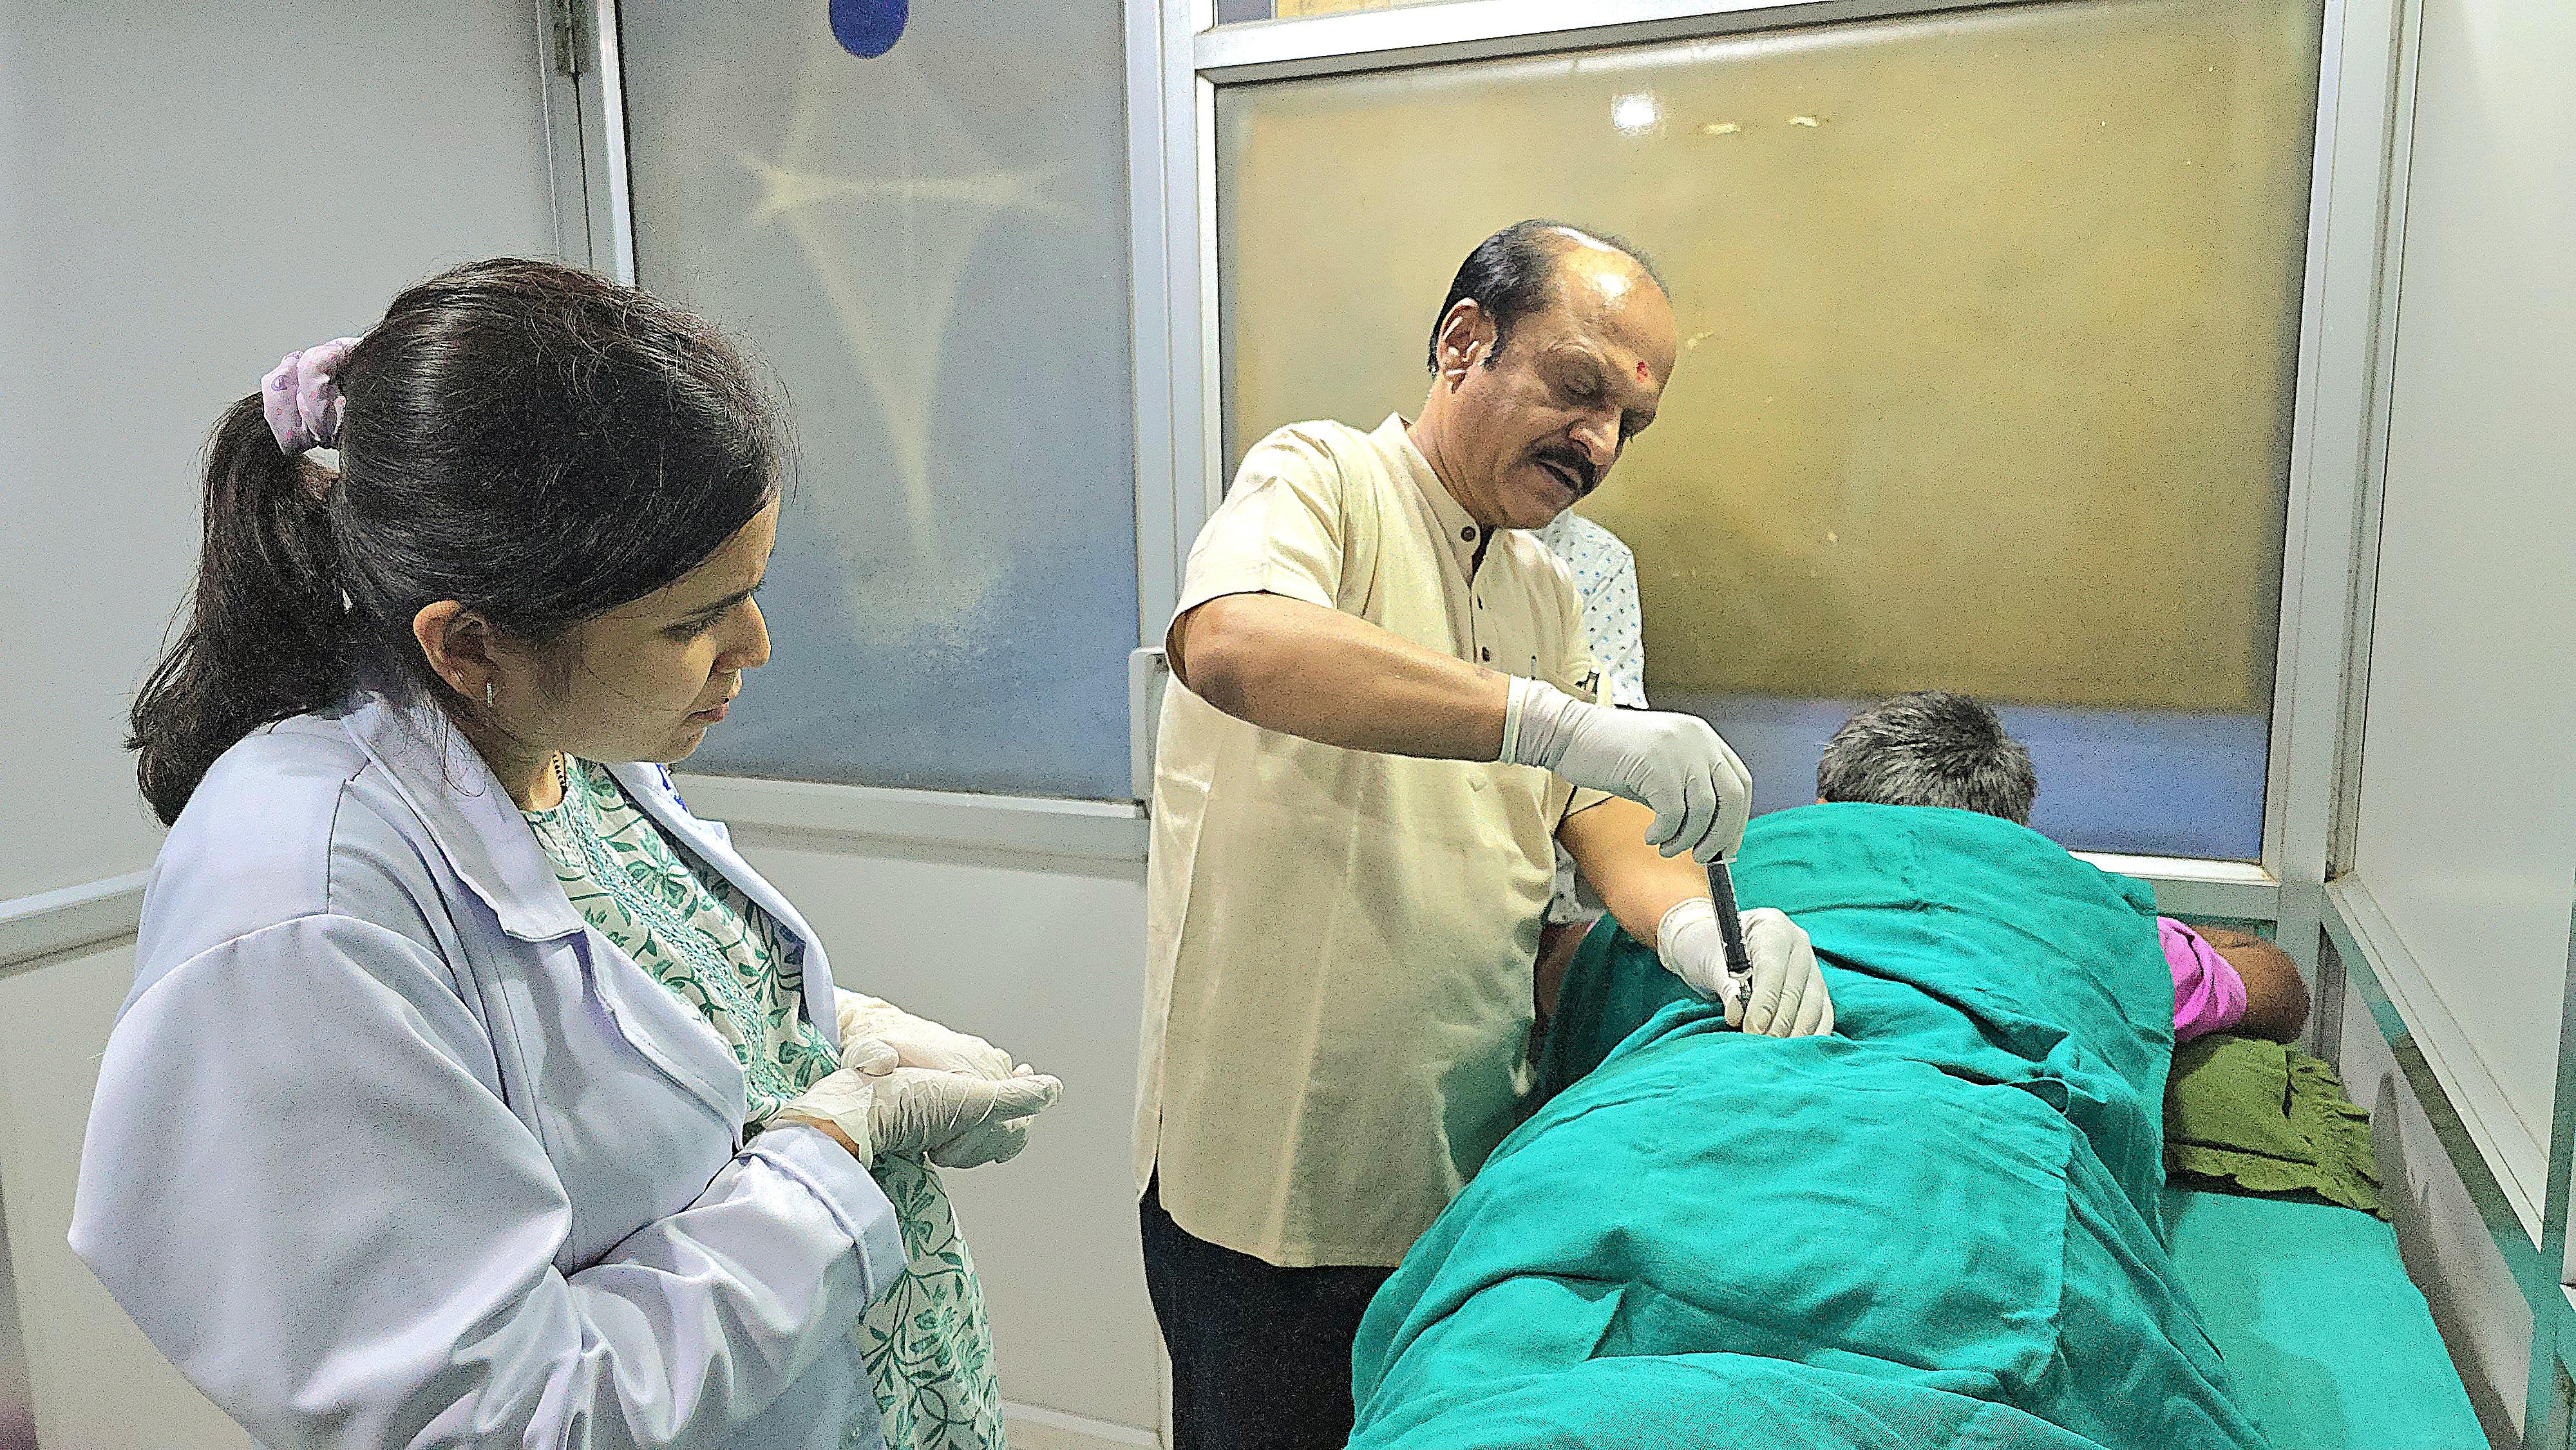
Expert Medical Professionals
Highly qualified team dedicated to your health
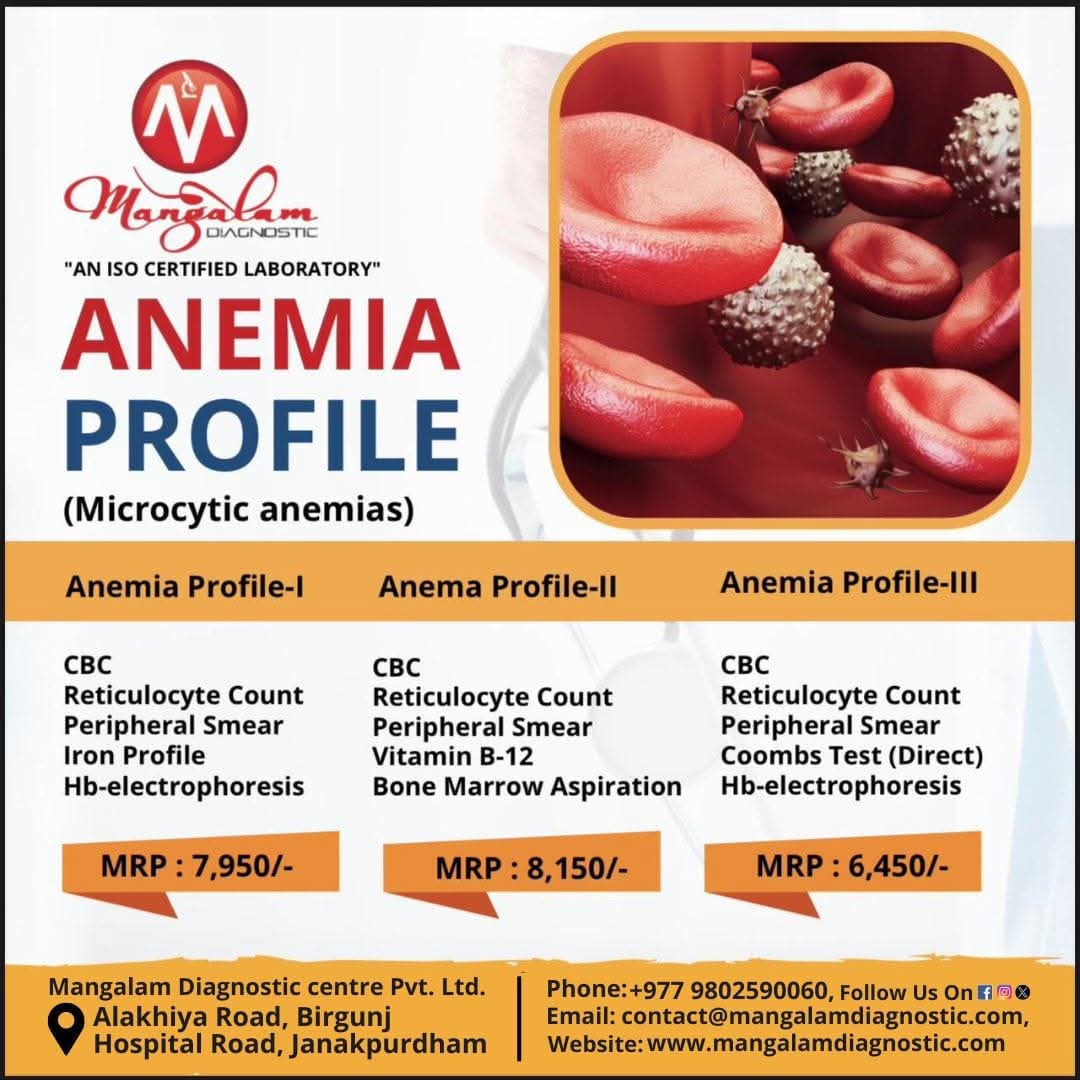
Anemia Detection
Complete blood profile for anemia screening
Comprehensive Testing
Wide range of diagnostic tests under one roof
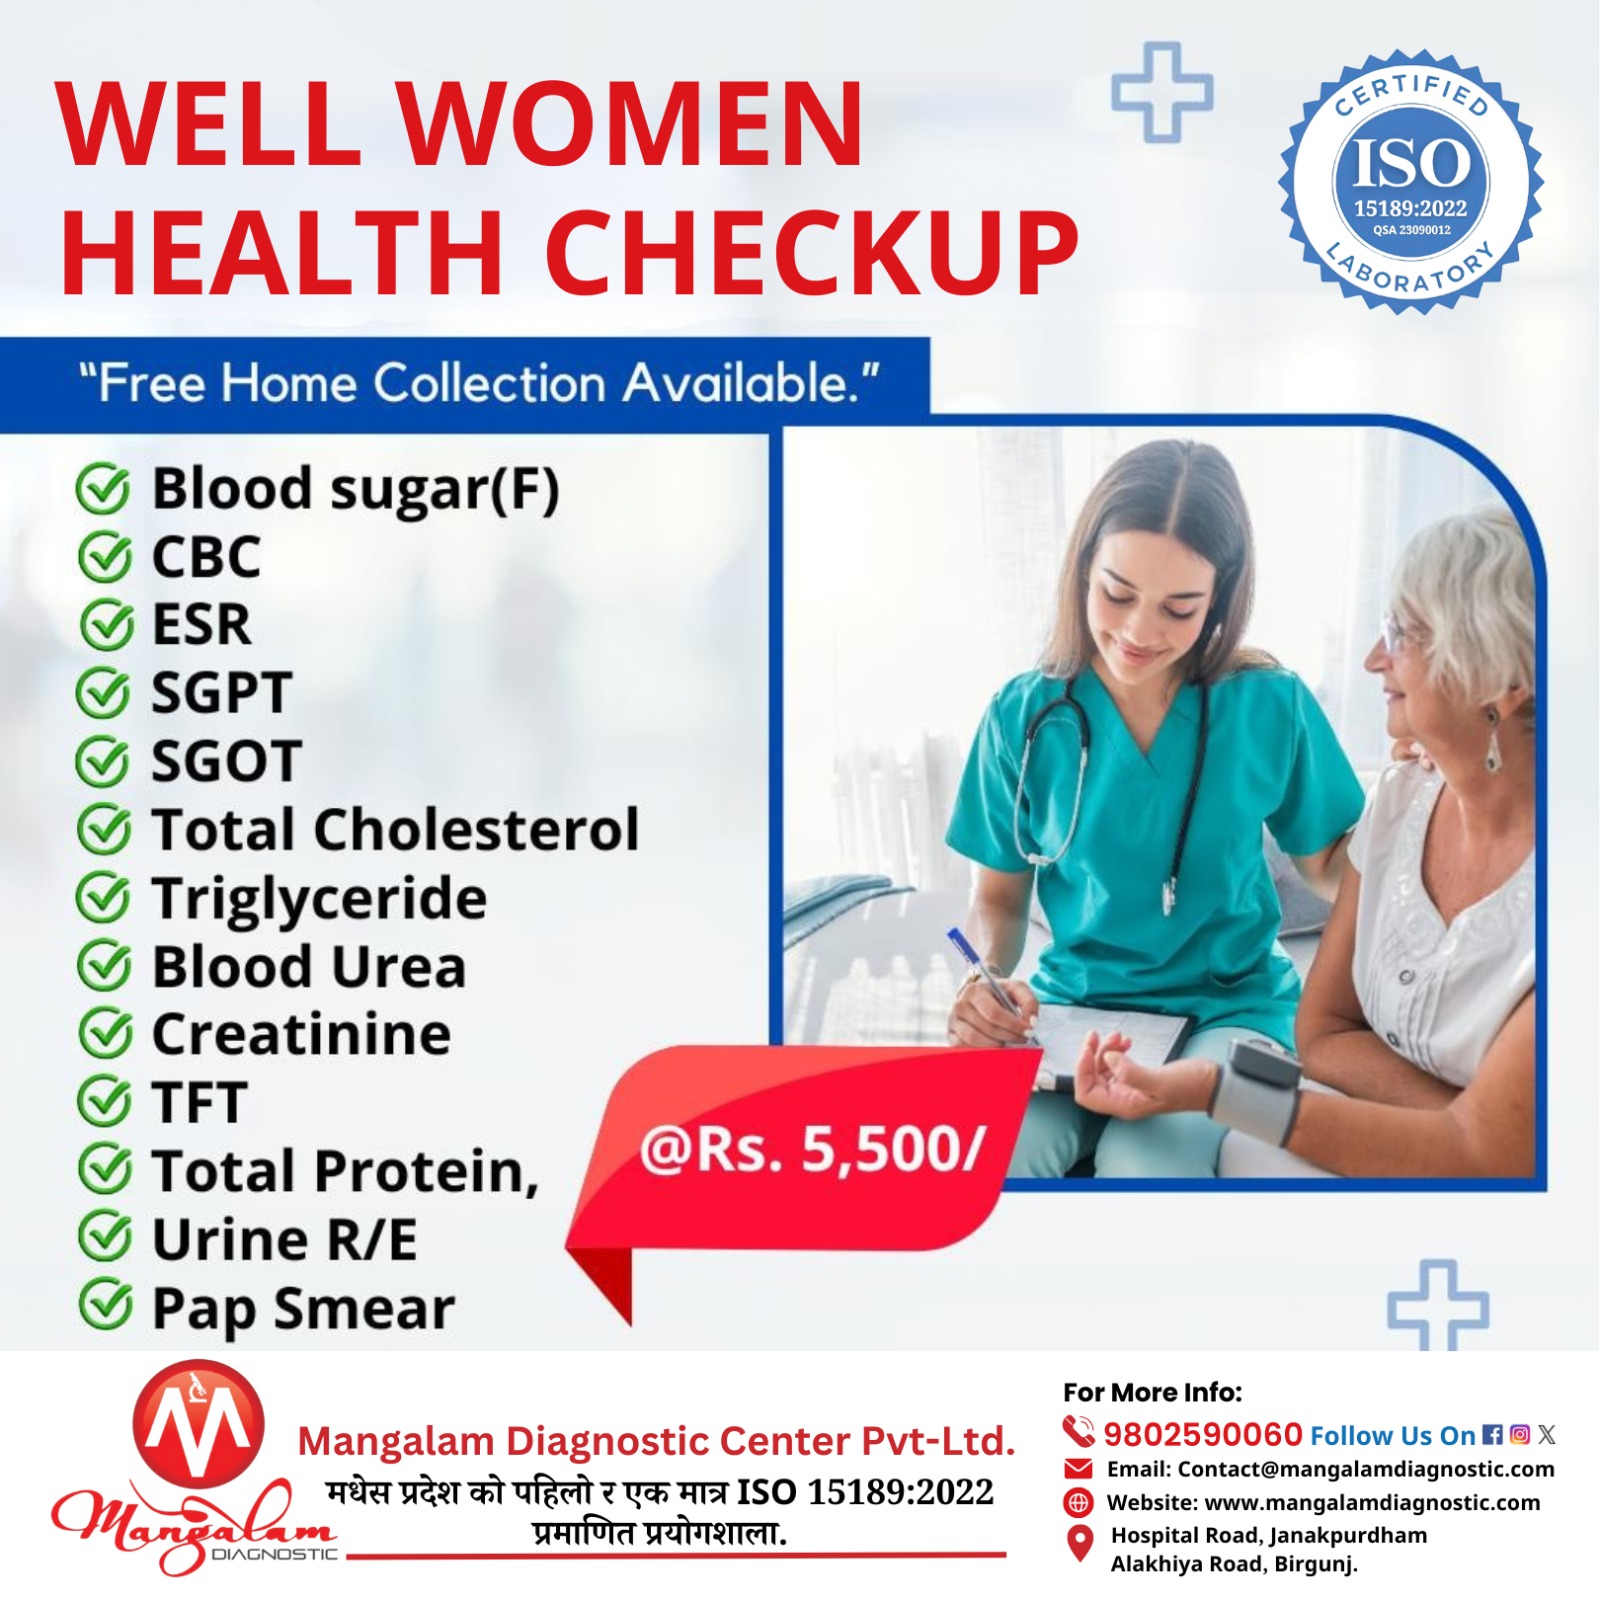
Women's Health Packages
Specialized health packages for women
Our Lab Certifications
NPHL Approved Laboratory
OLAB Accredited
ISO 15189:2022 Certified
ISO 15189:2022 Certified
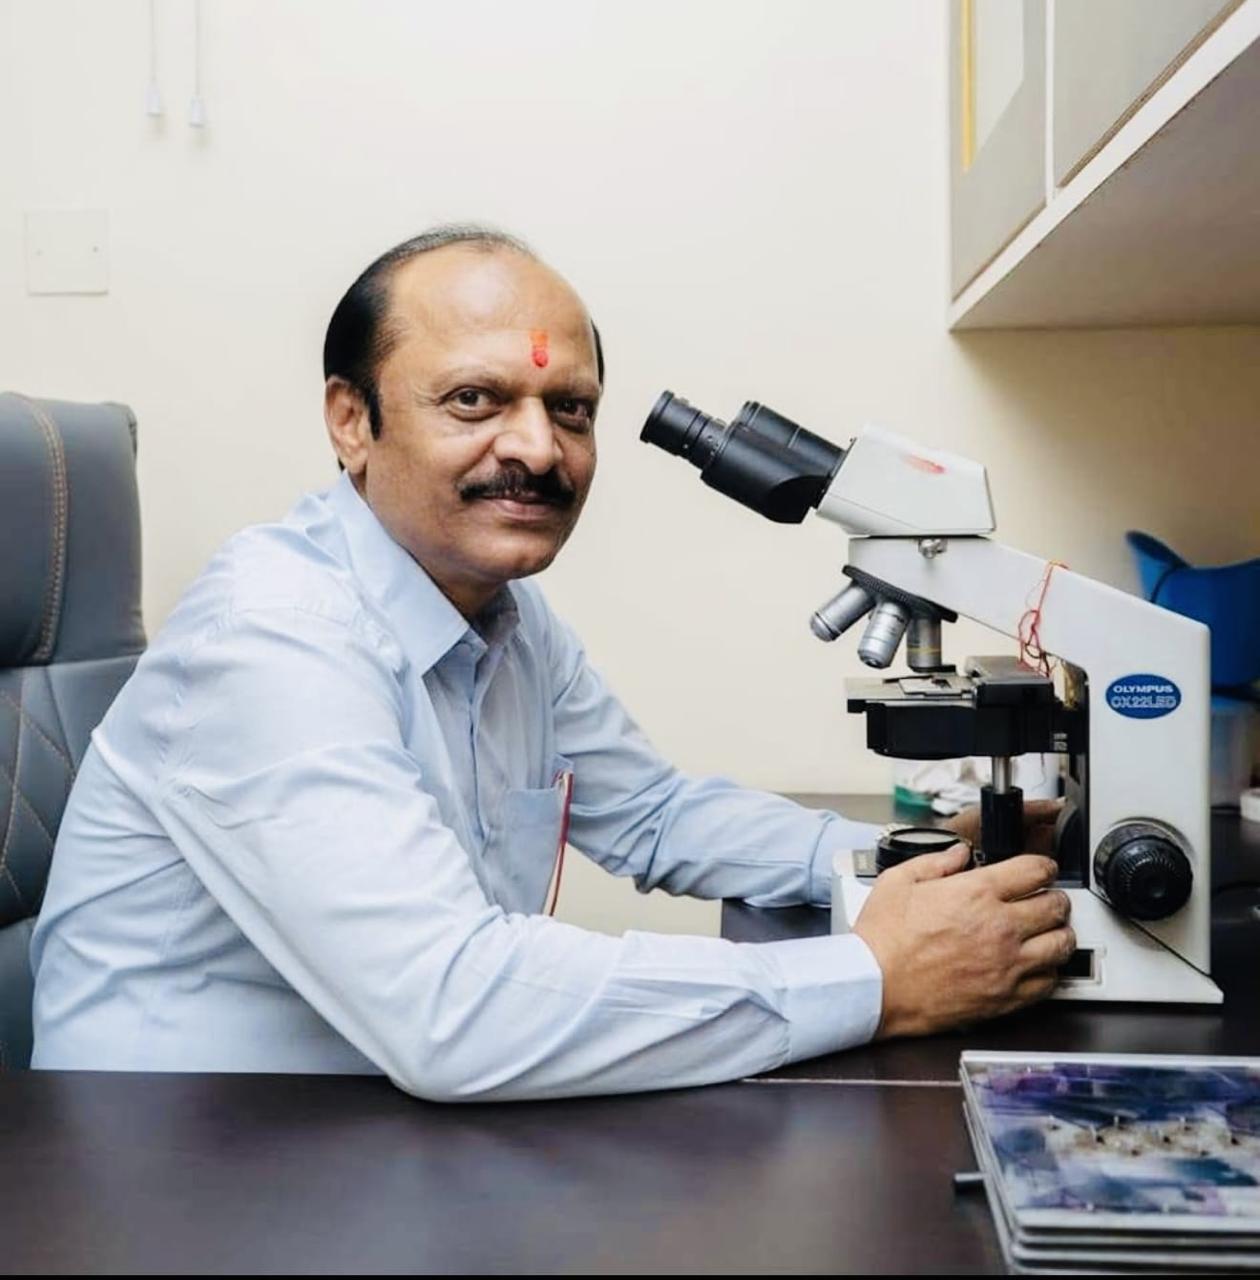
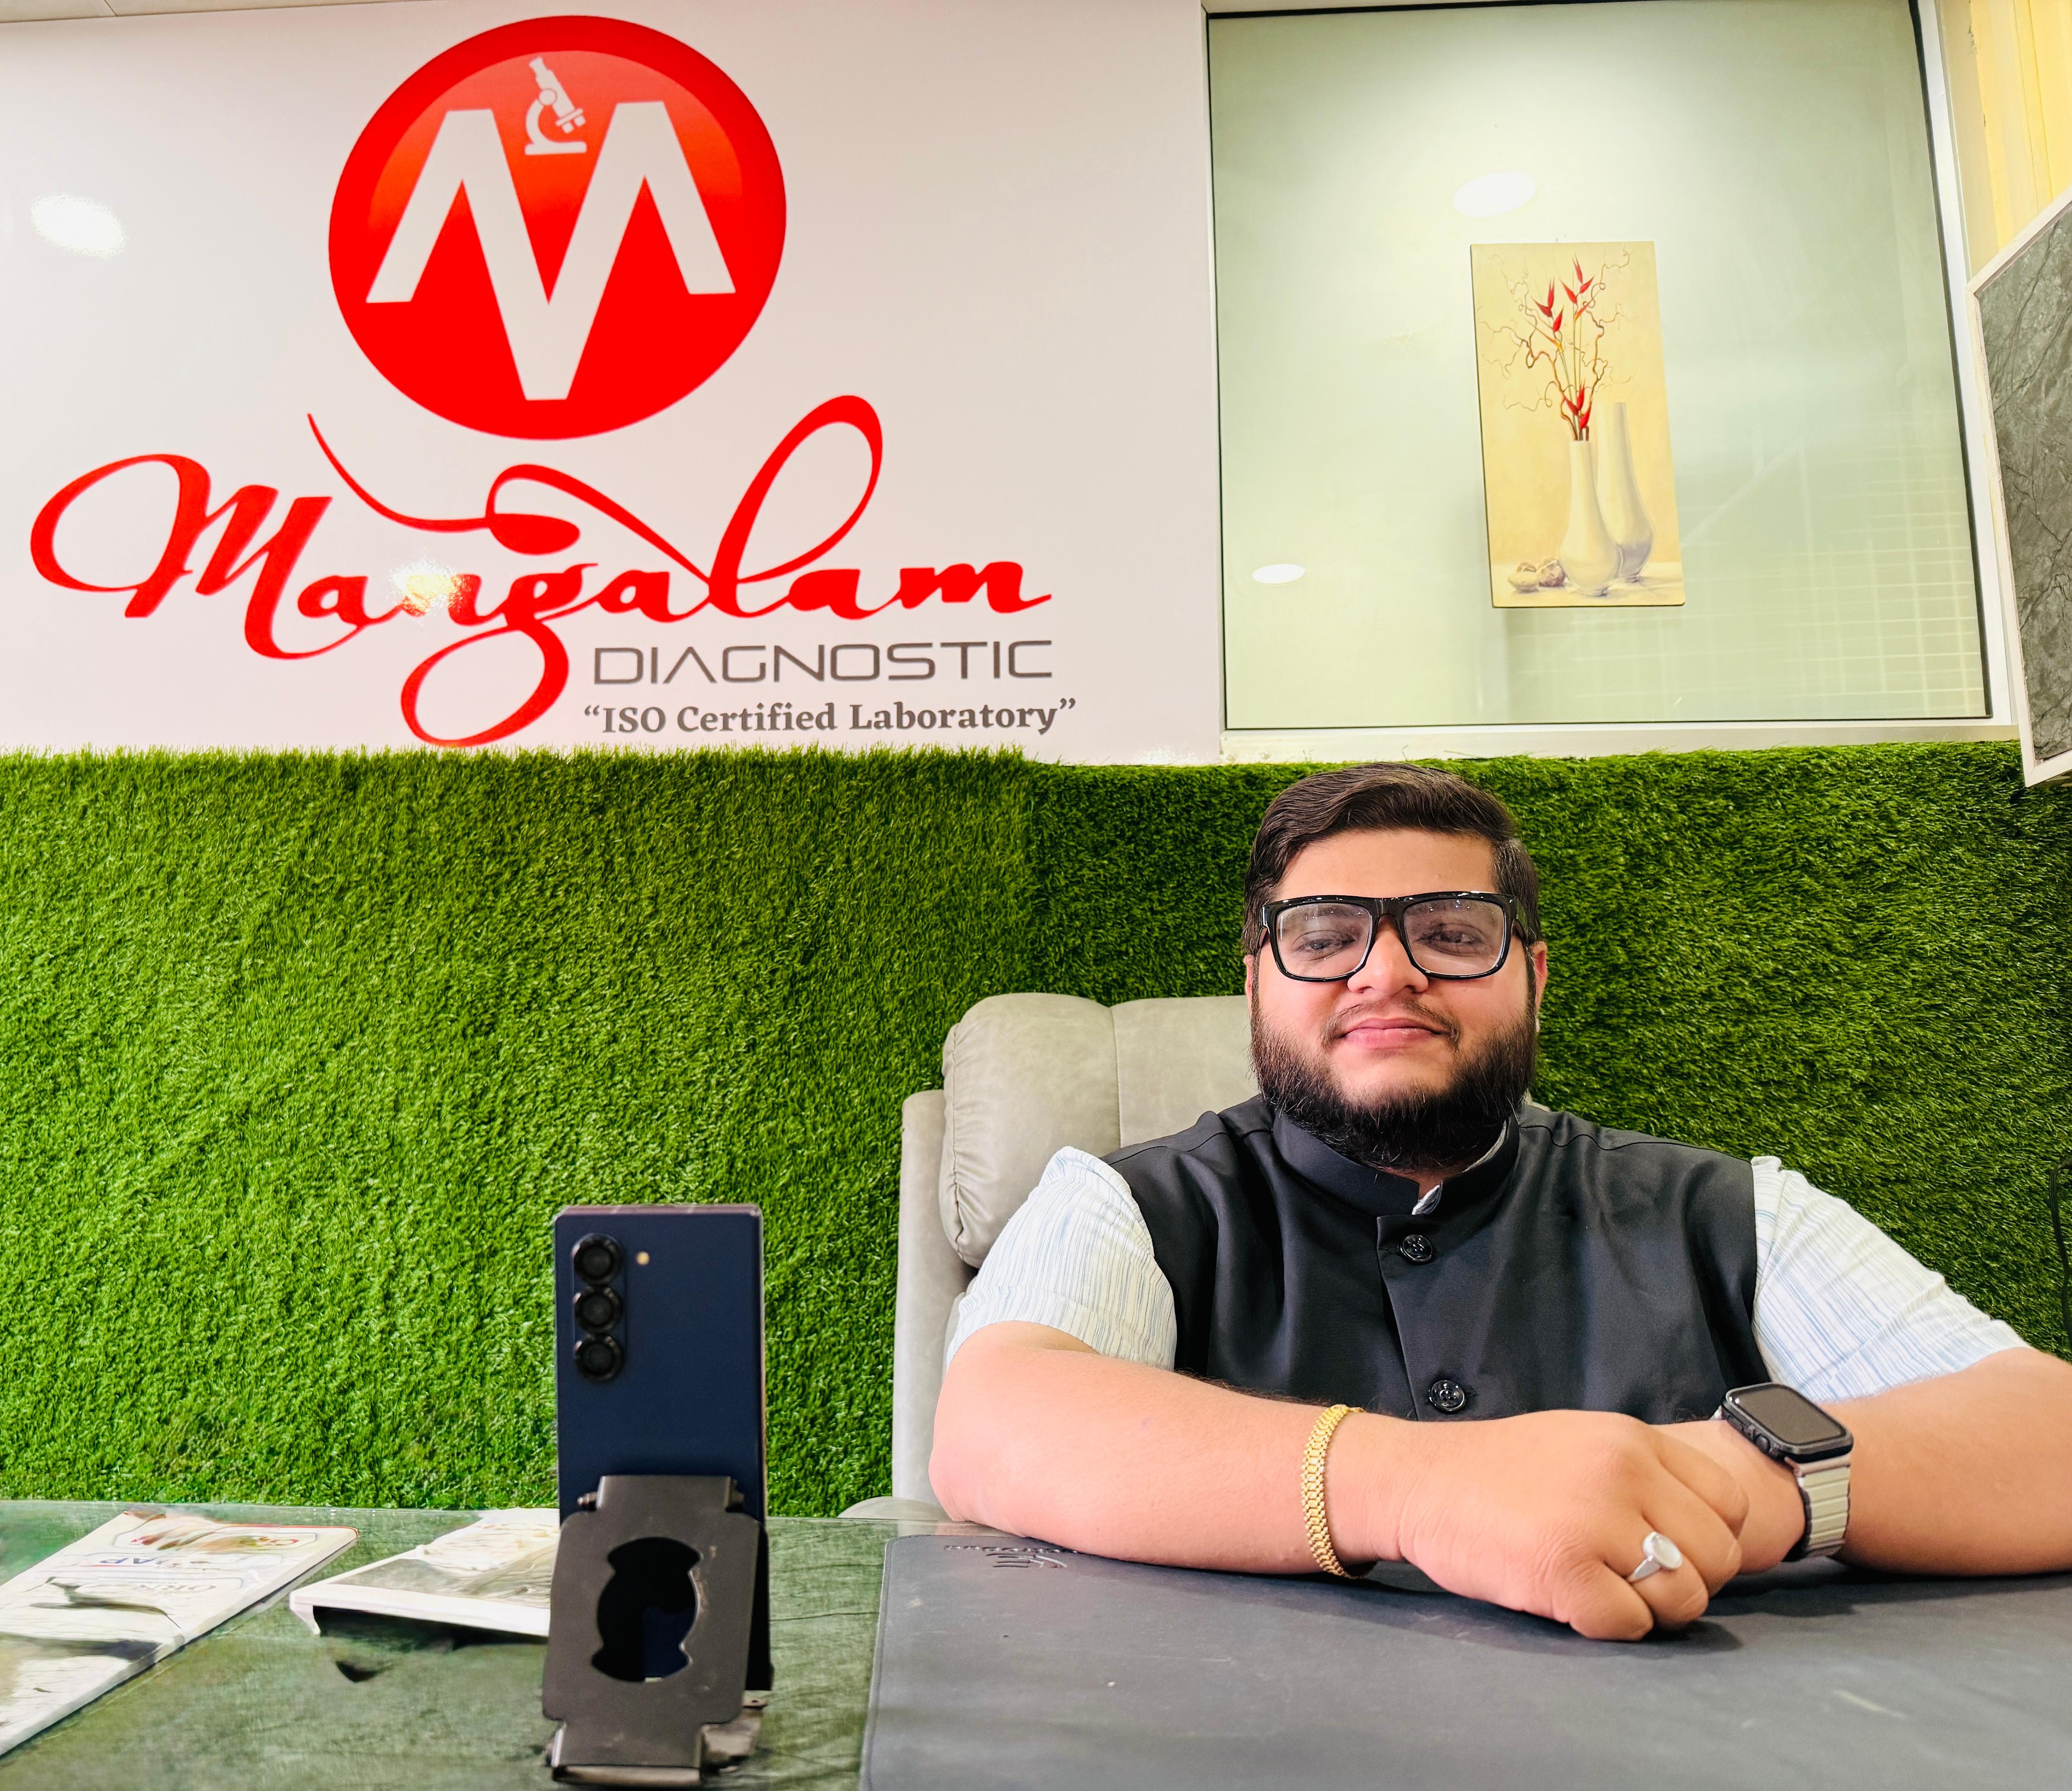
Message from the Chairman
Mangalam Diagnostic Center Pvt. Ltd. is a trusted name in healthcare diagnostics in Nepal, committed to delivering accurate, reliable, and timely diagnostic services since its establishment in 2070 B.S. We take pride in being the first and only ISO 15189:2022 certified laboratory in Madhesh Province, Nepal, setting the benchmark for quality and excellence in laboratory medicine. With state-of-the-art technology, modern infrastructure, and a team of highly qualified professionals, we ensure precision in every test we conduct.
"I thank our patients, doctors, and partners for their continued faith in us. Together, we will keep working toward a healthier tomorrow."
Prof. Dr. A.N. Thakur
MBBS (JIPMER), MD (AIIMS New Delhi)
Chairman & Senior Consultant Pathologist
30 Years of Experience
Message from the Managing Director
At Mangalam Diagnostic, our mission is simple: to provide accurate, reliable, and affordable healthcare diagnostics. Since 2070 B.S., we have been committed to excellence, and as the first ISO 15189:2022 certified laboratory in Madhesh Province, we proudly set new standards in quality and trust.
"I thank our patients, doctors, and partners for their continued faith in us. Together, we will keep working toward a healthier tomorrow."
Mr. Arth Thakur
Managing Director
First ISO 15189 in Province
Our Main Service
- Book Home Collection Online
- Collection Centre
- Report Login
- Payment
- Payment Method
- Tests
Our Collection Centre
Mangalam Diagnostic Center Pvt. Ltd.
Head Office
Phone: +977-51-522999
Birgunj, Madhesh Pradesh, Nepal
Janakpur Branch : 9802590060br
Make An Appointment
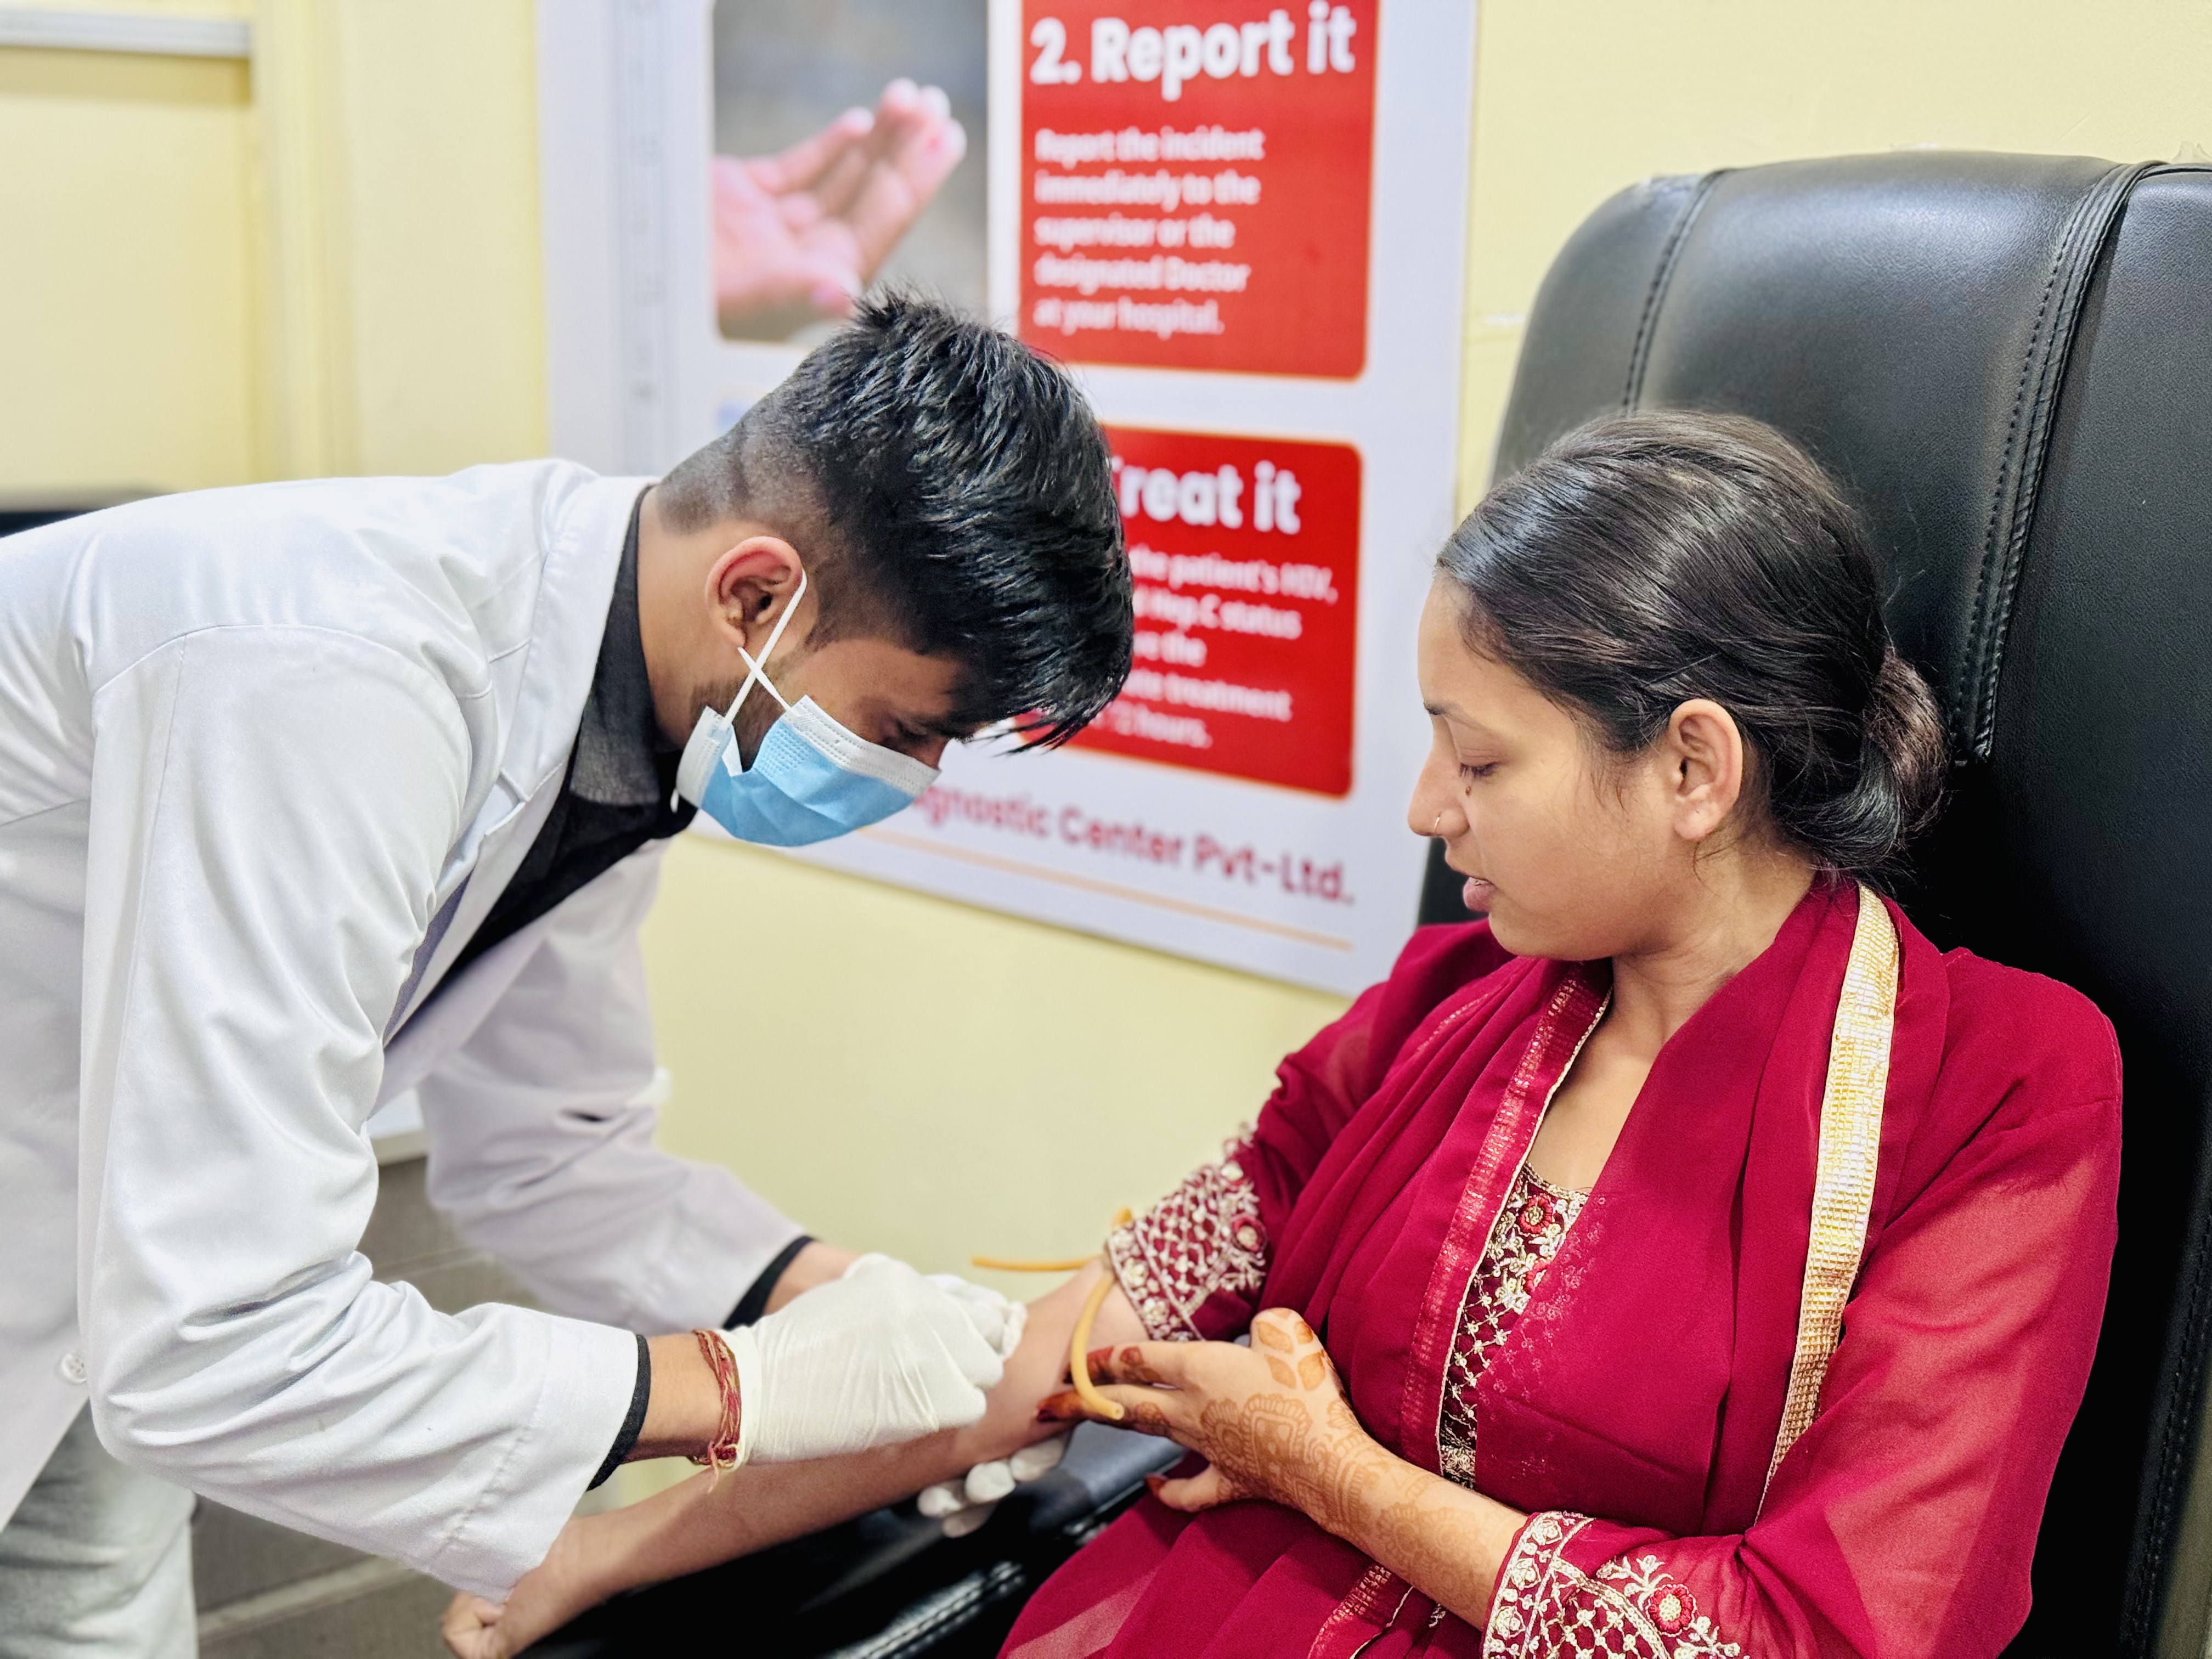
Mangalam Diagnostic Center offers convenient home sample collection services for all your diagnostic needs. Our trained phlebotomists will visit your home to collect samples at your preferred time.
Our Services
We offer a wide range of diagnostic services to meet all your healthcare needs
Blood Tests
Comprehensive blood analysis including CBC, lipid profile, thyroid function, and more.
- Quick Results
- Expert Analysis
- Home Collection
Health Packages
Comprehensive health checkup packages tailored to your needs.
- Full Body Checkup
- Preventive Care
- Detailed Reports
Why Choose Mangalam?
We are committed to providing the best diagnostic services
Strong reputation
Decades of trusted service
Quality assured
ISO 15189:2022 certified
Wide Test Range
1800+ tests under one roof
Technology
Fully automated lab
Affordable
Value for money services
Support
24x7 customer support
Home Collection
Free sample collection
Quick Reports
Same day results
What Our Customer Says
Hear from our satisfied customers
Our Corporate Partners
Trusted by leading organizations in Nepal
Britannia Nepal
Corporate
Dabur Nepal
Corporate
Surya Nepal
Corporate
Kansai Nerolac Paints, Nepal
Corporate
Mahalaxmi Bikas Bank Limited
Corporate
SuryaJyoti Life Insurance
Insurance
IGI Prudential Insurance
Insurance
NexGen Management & Equity Solutions
Corporate
Nepal Mediciti Vayodha Hospitals
Hospital
Surya Hospital, Birgunj
Hospital
Terai Modern Healthcare Hospital Simara
Hospital
Janakpur Neuro Hospital
Hospital
Monastic Higher Secondary English Boarding School Janakpur
Education
Our Expert Team
Meet our team of experienced healthcare professionals
Mr. ARTH THAKUR
Managing Director
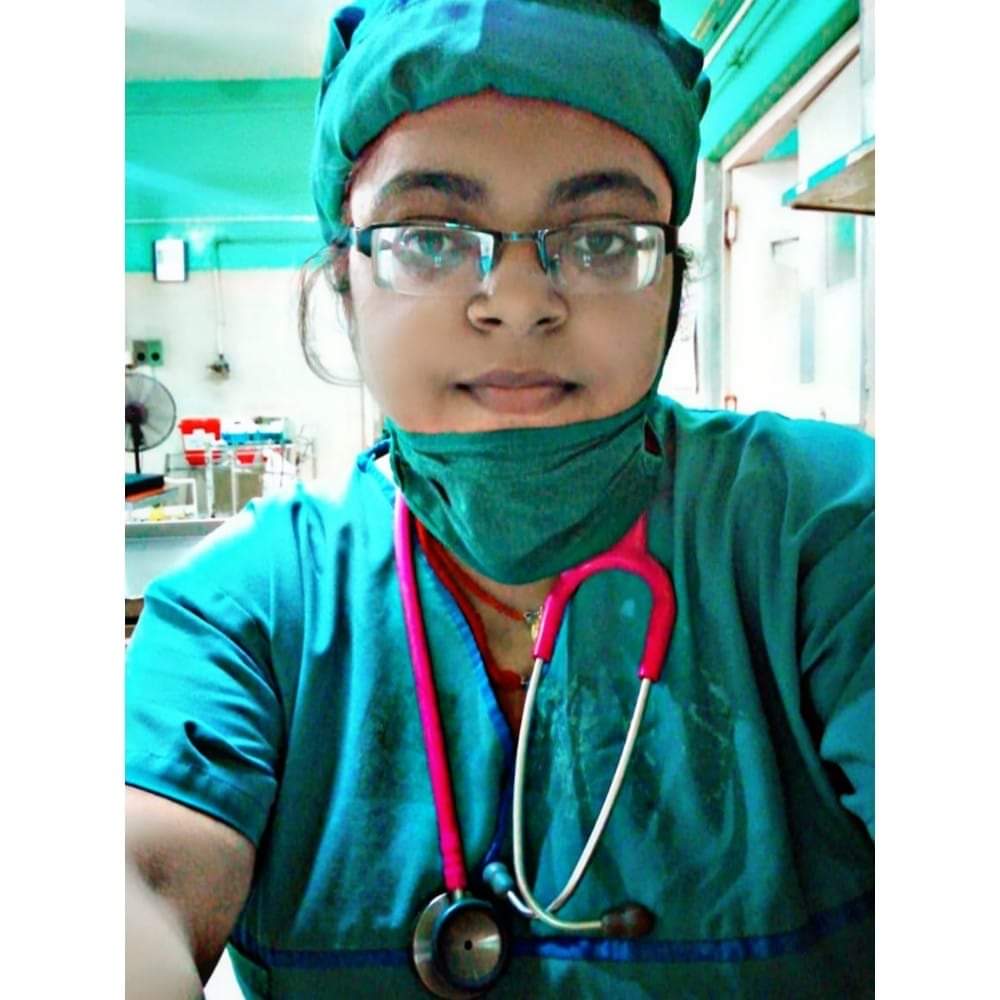
Dr. ASHIYANA THAKUR
Consultant
MBBS, (BPKIHS, Dharan)
NMC Num.25211
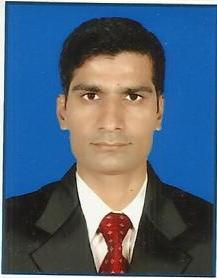
Mr. SHYAM NIDHI
Country Manager
MBS (TRMC, T.U. Birgunj)
Ready to Book Your Appointment?
Take the first step towards better health. Schedule your diagnostic test today.